How to read a crypto drawdown
- Research, published
- 21 November 2026
- Data to
- 21 November 2026
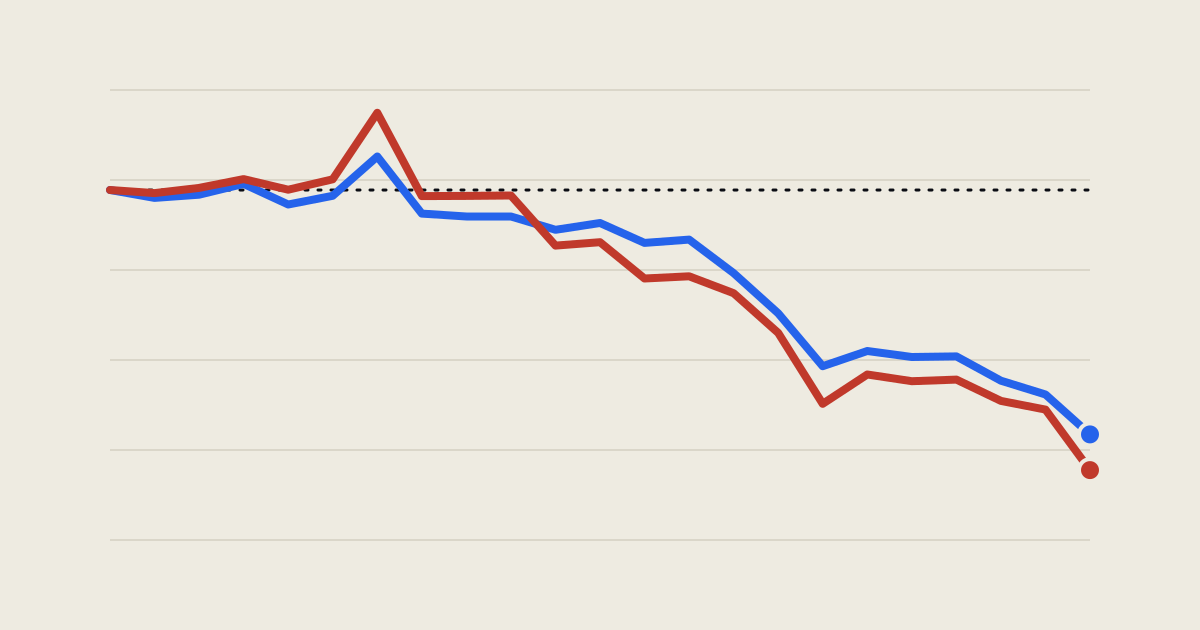
Headlines about a crypto fall rarely agree, because each one picks its own start, its own end and its own clock. This week Ether's weekly fall was reported anywhere from about 11% to 19%. They can all be correct, and none of them can be compared. So here is a method you can reuse, with this week as the worked example.
The method: fix the clock, then take three numbers
- Fix the window and the clock. We use daily prices at 00:00 UTC, from 30 October to 21 November 2026. The 21 November print is the close of 20 November.
- Depth: the percentage change from the start of the window to the end.
- Speed: the worst single-day move inside the window.
- Relative: how the second asset moved against the first, using the ETH/BTC ratio.
The numbers
| Measure | Bitcoin | Ether |
|---|---|---|
| Price, 30 Oct | $77,839 | $2,249 |
| Price, 14 Nov | $68,243 | $1,928 |
| Price, 21 Nov | $58,818 | $1,620 |
| Depth, 14 to 21 Nov (one week) | -13.8% | -16.0% |
| Depth, 30 Oct to 21 Nov | -24.4% | -28.0% |
| Worst single day | -6.0% (15 Nov) | -8.3% (15 Nov) |
The ETH/BTC ratio moved from 0.02890 on 30 October to 0.02825 on 14 November and 0.02753 on 21 November. That is a fall of 2.5% over the week and 4.7% over the window. Ether fell more than Bitcoin in both windows, but not by a wide margin: over the week, Ether's move was about 1.16 times Bitcoin's.
What the numbers say, and what they do not
- The fall got faster, not just deeper. The typical daily swing in the last seven days was 2.6% for Bitcoin and 4.0% for Ether. Across the first 14 daily moves of the window it was 2.2% and 3.2%. Those are small samples, so treat them as a description, not a measurement of anything permanent.
- The series peaked on a single day. The highest print was 5 November ($80,443 and $2,423), then it fell back the next day. Measuring from that one print would show falls of 26.9% and 33.2%, which looks more dramatic and depends on one day. We measure from a fixed start instead.
- Daily prints are snapshots. Exchange prices went lower than the 00:00 UTC print during 20 November, so the lowest price you saw on a screen can sit below the figures above.
This is a description of what happened, and not a forecast. We do not call bottoms.
Not financial advice. See the disclaimer and how a verdict is made.
Sources: BTC and ETH daily prices at 00:00 UTC, read 21 November 2026. Press weekly figures for comparison: Bitcoin.com, TradingView.
The weekly signal
One email a week with the board's verdicts, what changed, and the data behind it. Free, no price calls, unsubscribe any time.
Get the weekly signalOpens our newsletter form. See the privacy policy.