Real-world assets in a crypto sell-off
- Research, published
- 21 November 2026
- Data to
- 21 November 2026
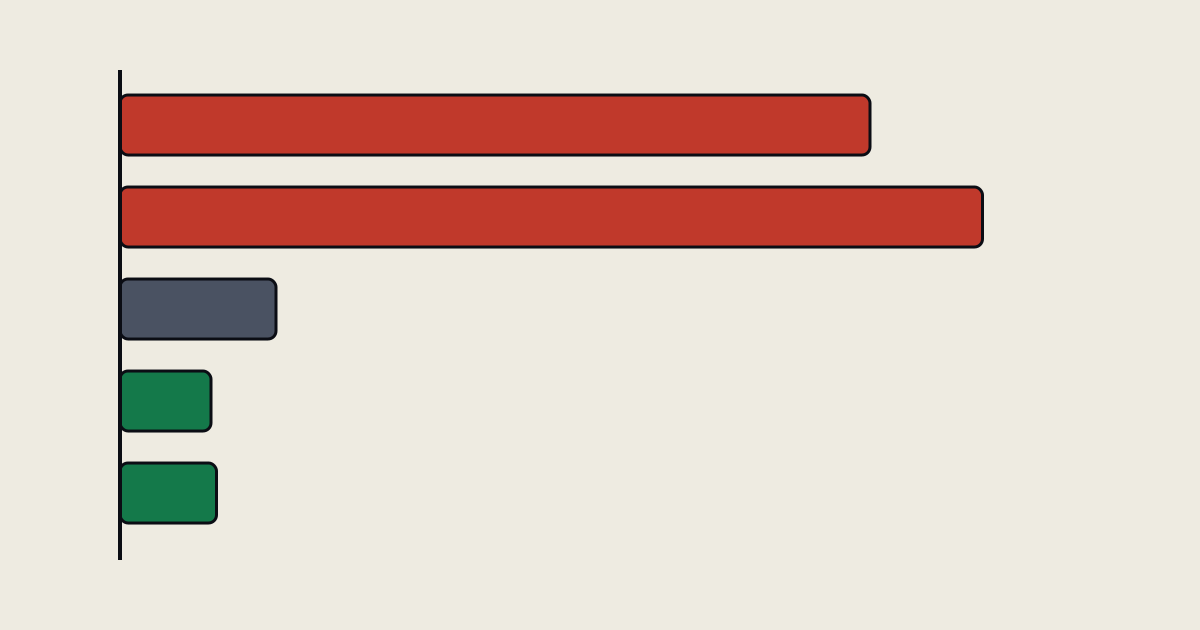
When crypto prices fall hard, the claim that real-world assets are a safer corner of the market gets repeated. Here is a first test of it, using one 30-day window and one source for each side.
The comparison
| Over 30 days to 21 Nov 2026 | Change |
|---|---|
| Bitcoin (22 Oct to 21 Nov) | -30.0% |
| Ether (22 Oct to 21 Nov) | -34.5% |
| Stablecoin value | -6.24% |
| Distributed real-world assets | -3.64% |
| Tokenised US treasuries | -3.86% |
| Represented assets | +22.26% |
Crypto prices are daily prints at 00:00 UTC on 22 October and 21 November. The other rows are RWA.xyz's own 30-day change. The two windows are close but not identical, because the sources use different clocks, so read the gap as a rough size and not an exact one.
Why the gap is smaller than it looks
A tokenised treasury fund is built to hold a steady price per token. Its total value therefore moves mostly with money going in and out, and hardly at all with price. A fall of 3.9% is a drop in the amount of money held, and not a drop in what each token is worth. Bitcoin and Ether prices have no such anchor, so their moves are mostly price.
That means "held up" is the right phrase, and "performed well" is not. Nothing here shows tokenised treasuries gained while crypto fell.
What stands out
- Cash left too. Stablecoin value fell 6.24%, more than treasuries, which is consistent with some money leaving the on-chain dollar system and not simply moving into treasuries. The data does not show where it went.
- The category is not the leaders. The category fell 3.86%, but BlackRock's BUIDL stands at about $1.55 billion, against a press-reported peak near $2.9 billion in June 2025. One product's slide is not visible in the category total.
- Represented assets rose 22.26%. That is a different measure, covering on-chain records of assets held elsewhere, and it moves for different reasons. We keep it separate on purpose.
What this cannot tell us
One 30-day window is one event. We do not know whether treasuries would hold up in a longer or a different kind of fall, and the data here does not show why money moved. Treat it as a first data point.
Not financial advice. See the disclaimer.
Sources: RWA.xyz global overview and RWA.xyz treasuries, as of 21 November 2026. Crypto prices: daily 00:00 UTC prints on 22 October and 21 November. BUIDL peak: Cointelegraph via TradingView.
The weekly signal
One email a week with the board's verdicts, what changed, and the data behind it. Free, no price calls, unsubscribe any time.
Get the weekly signalOpens our newsletter form. See the privacy policy.